
Analytics
On the Analytics page, you will find graphs and statistics for all reports for the entire organization.
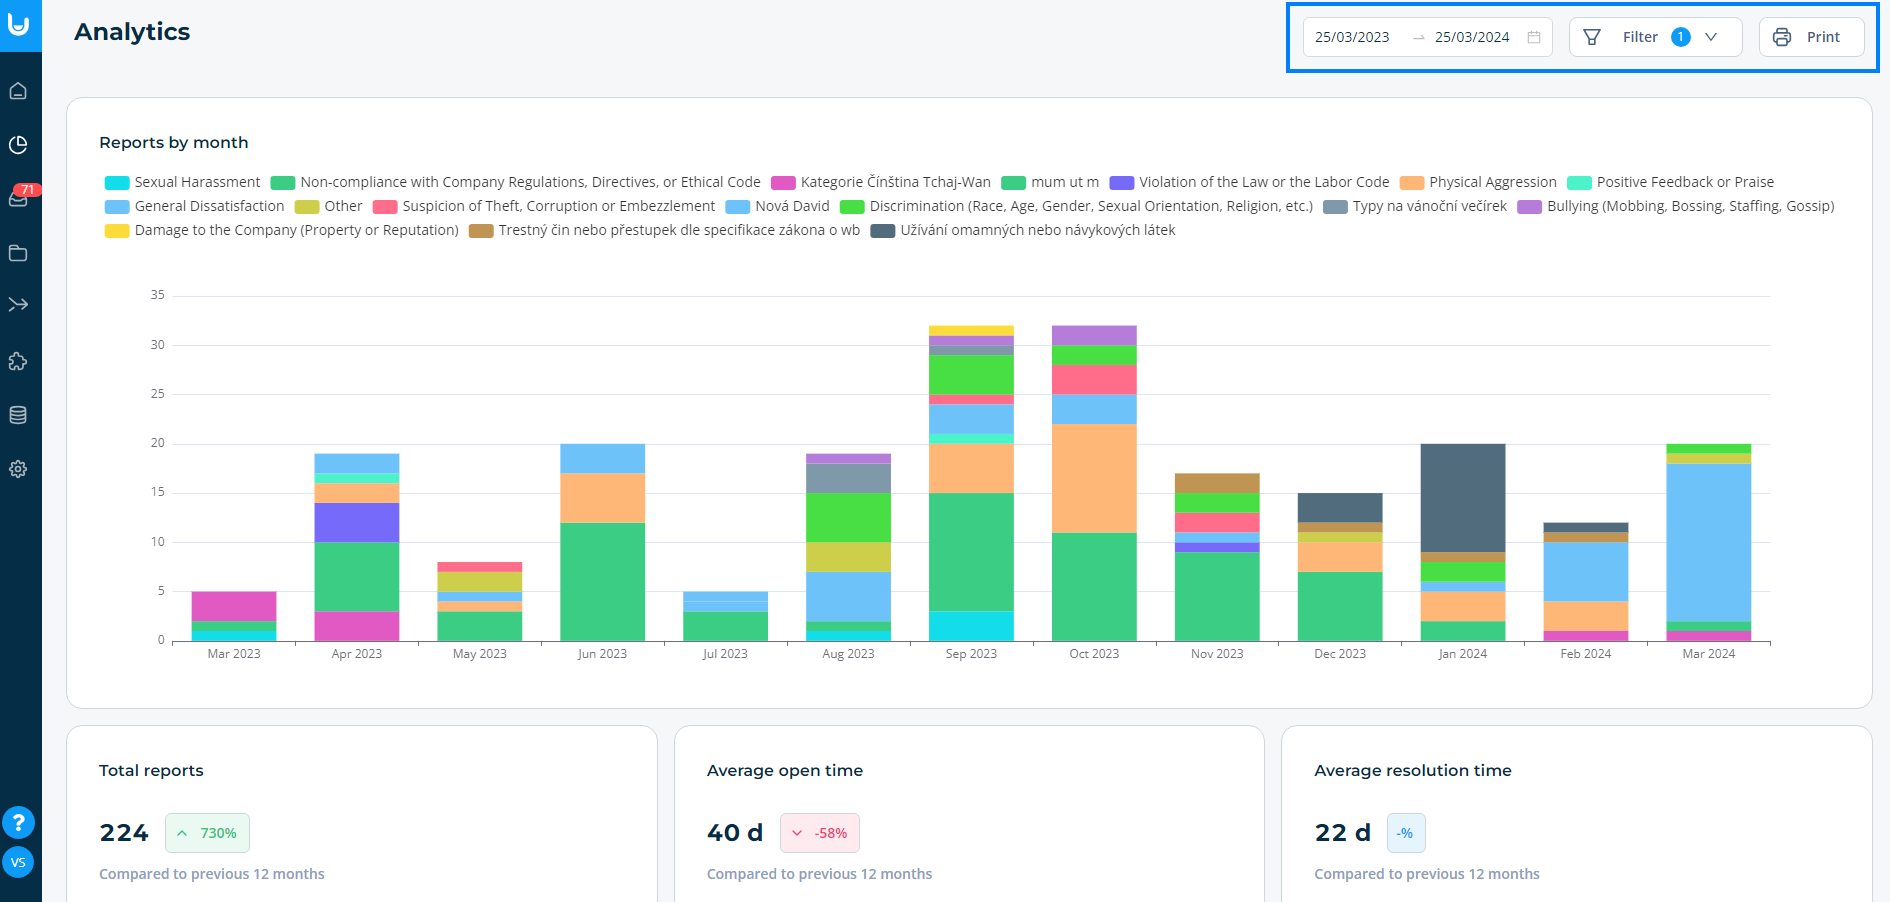
The data is automatically displayed for the previous year. You can modify the displayed period in the top right corner. There is also a filter that can be used to change the data display. For example, if your organization has multiple units, you can choose specific organizational units for which you want to display data.
The page with the graphs can be printed or downloaded as a PDF by clicking on the printer icon in the top right corner of the page.