
Dashboard
On the dashboard, you will find an overview chart of reports over the last twelve months. This is your personal statistics. Therefore, only the reports you have access to are displayed here. (You can then see the data for the whole organization on the Analytics page.)
On the right side of the chart, you'll find a section where you can see how many new, open, resolved, or overdue reports you have.
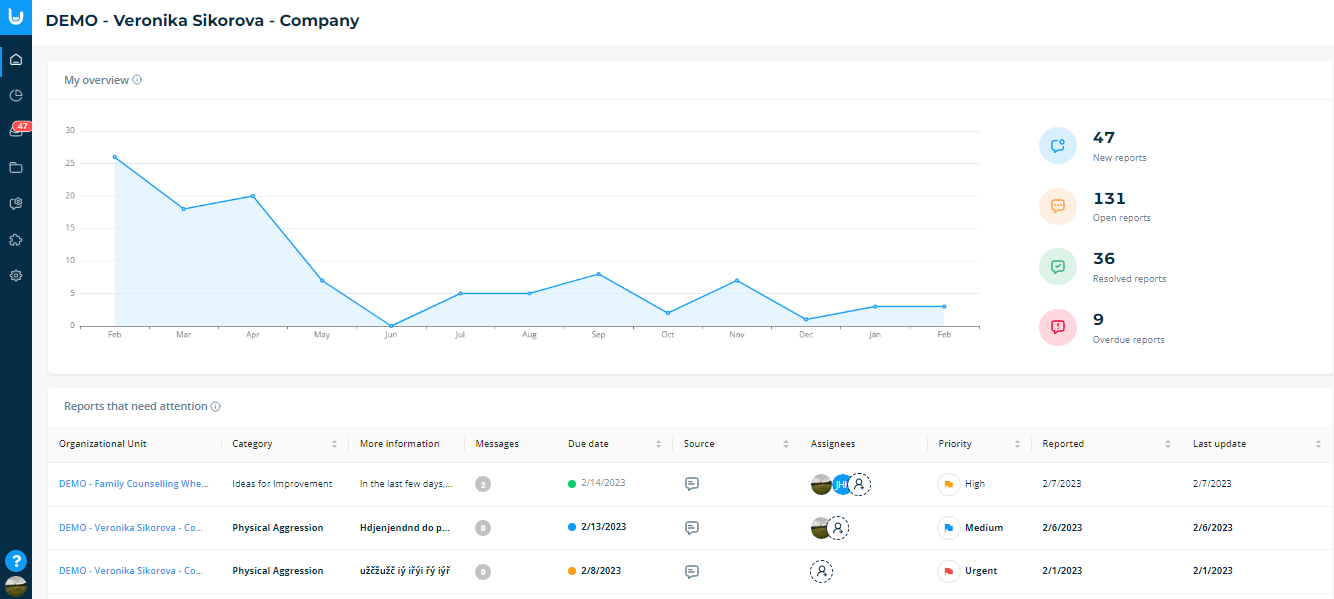
Below the main chart is a section that shows the reports that require your attention. Here you will find all new reports without an assignee and the unresolved reports assigned to you.