
How to use statistics in Power BI?
To use the statistics endpoint in Power BI (or related tools) you can use Power Query.
Prerequisites
To communicate with the FaceUp API you need to obtain your institution's API key and region. To do so check the related article.
Getting the data
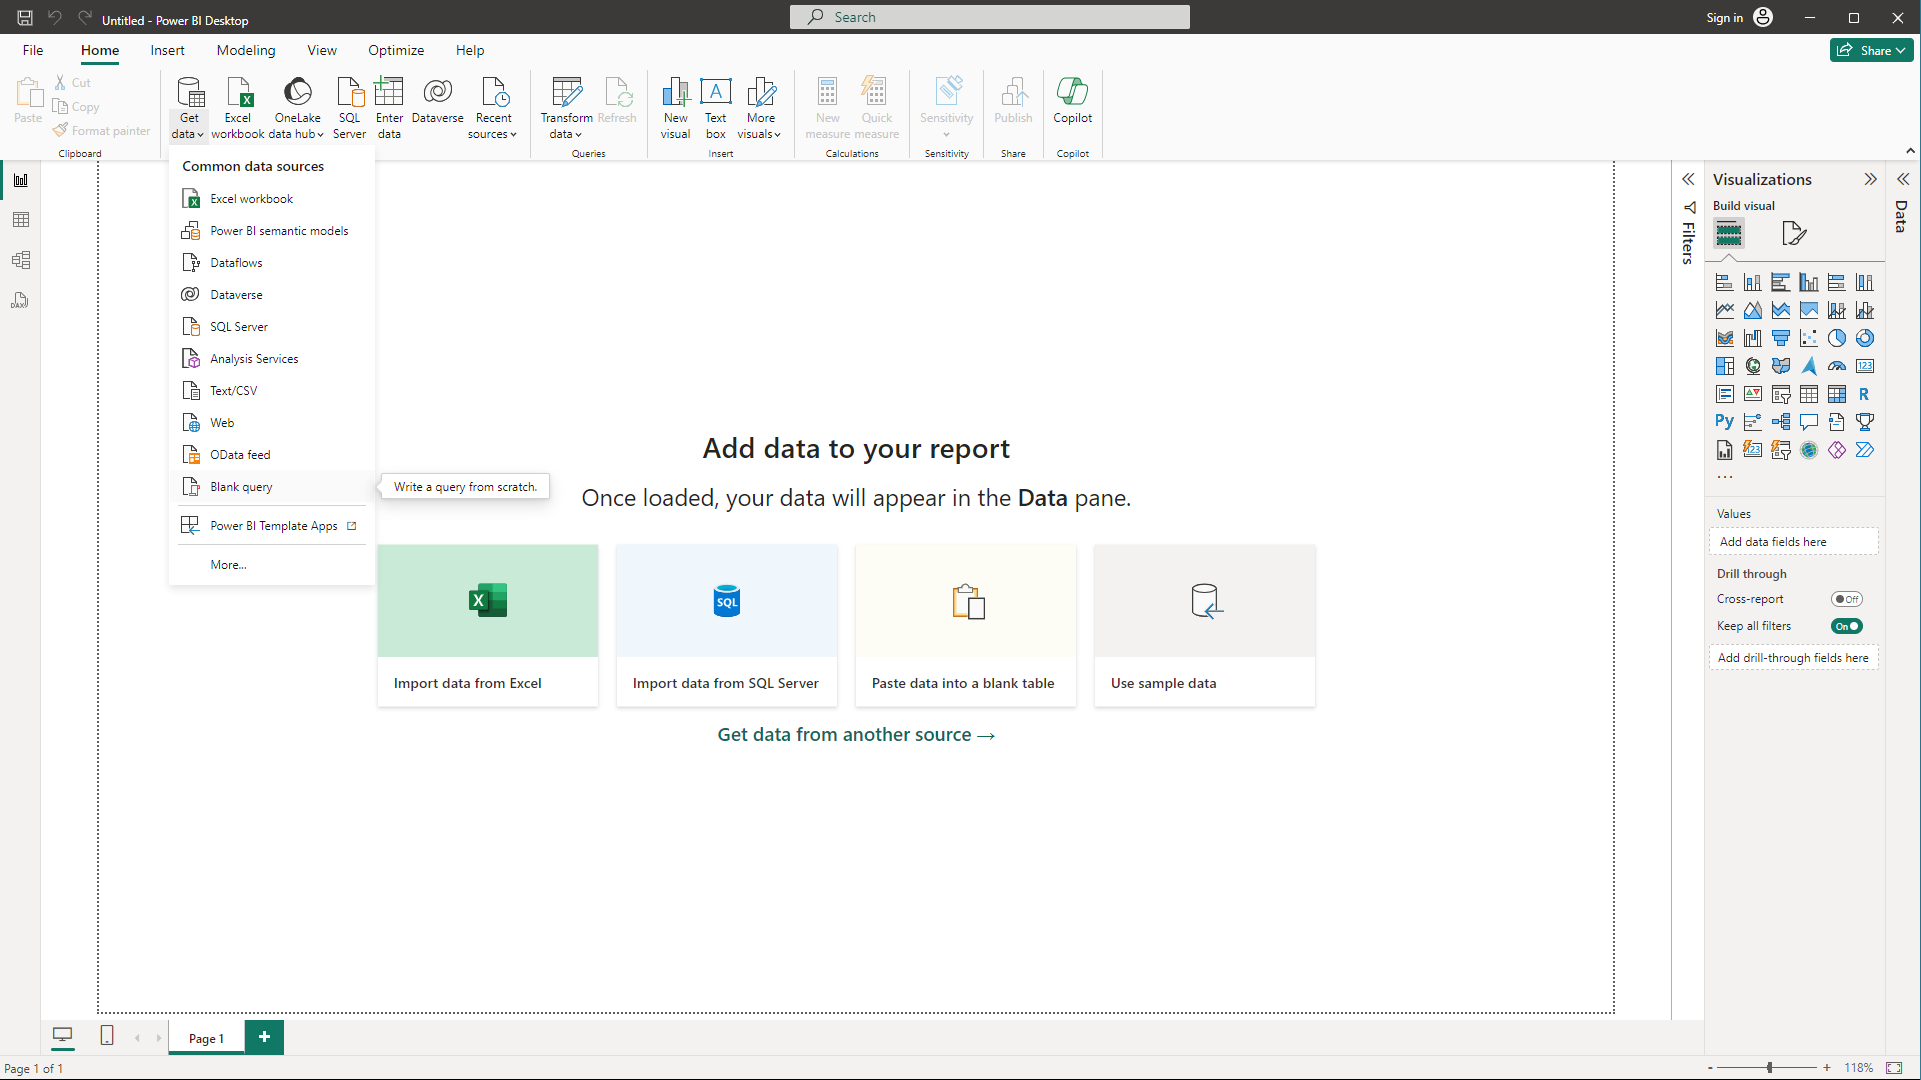
1. Open Power BI (or another tool using Power Query, such as Excel) and create new blank query.
2. Enter advanced editor.
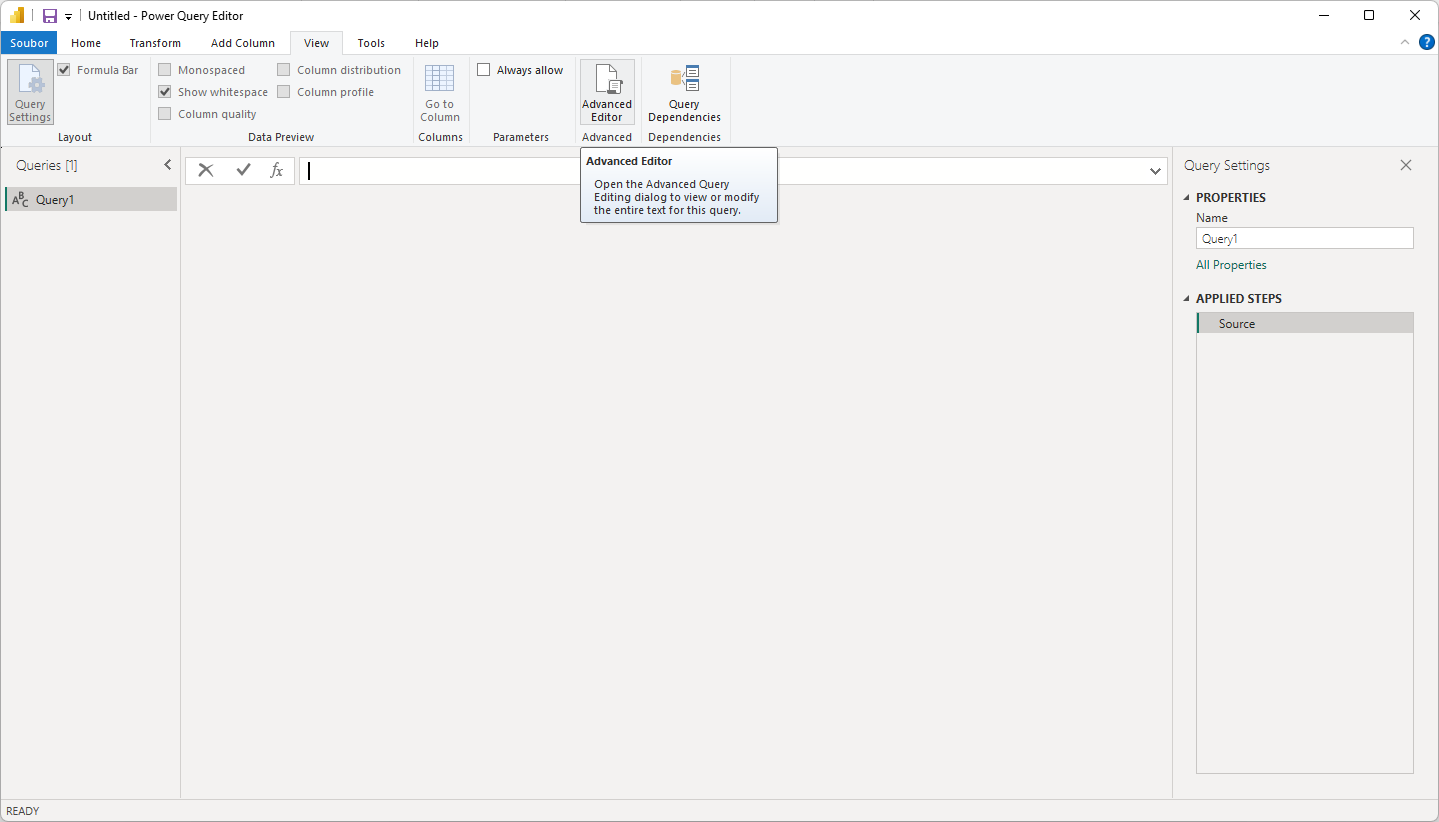
3. Paste following code into the window.

let ContentBody = Json.FromValue([ query = "query Statistics { publicStatistics( dateFrom: "2024-04-17T01:34:56.000Z" ) { reportCountByMonth } }" ]), Source = Json.Document(Web.Contents("https://www.api.faceup.com/graphql", [Content=ContentBody,Headers=[#"Content-Type"="application/json", #"X-Region"="eu-west-1",authorization="fui_xxxxxxxx-xxxx-xxxx-xxxxxxxxxx"]])), data = Source[data], publicStatistics = data[publicStatistics]in publicStatistics
4. Change the X-Region and authorization values to values from the administration (see Prerequisites).
5. Change the filters and results to what you want. You can also change this later as you want. Click Done.
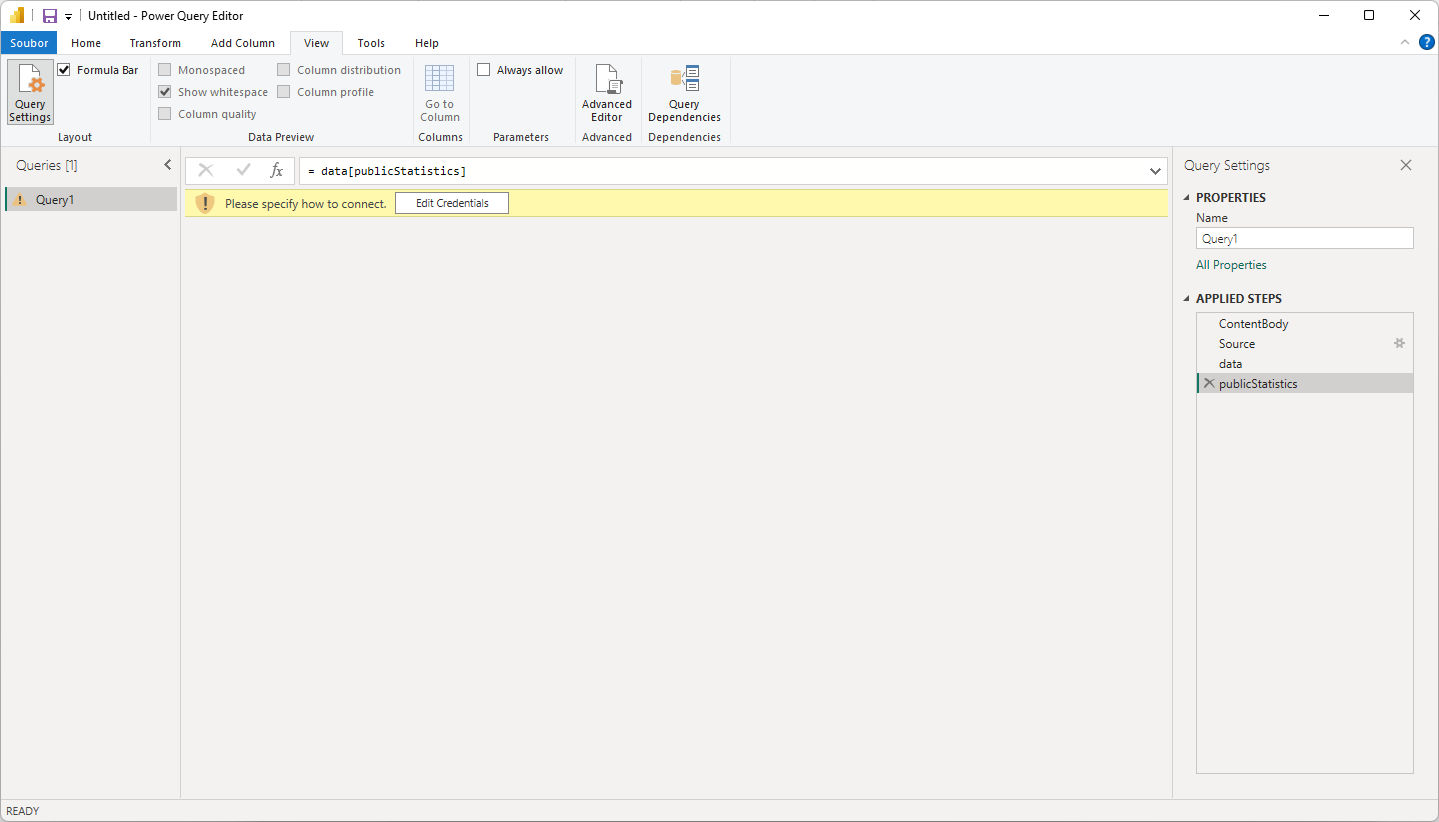
6. Click Edit Credentials.
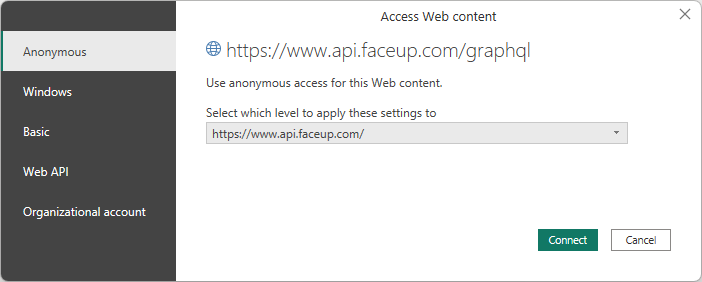
7. Click Connect.
8. Click Yes.
9. It will try to load data.
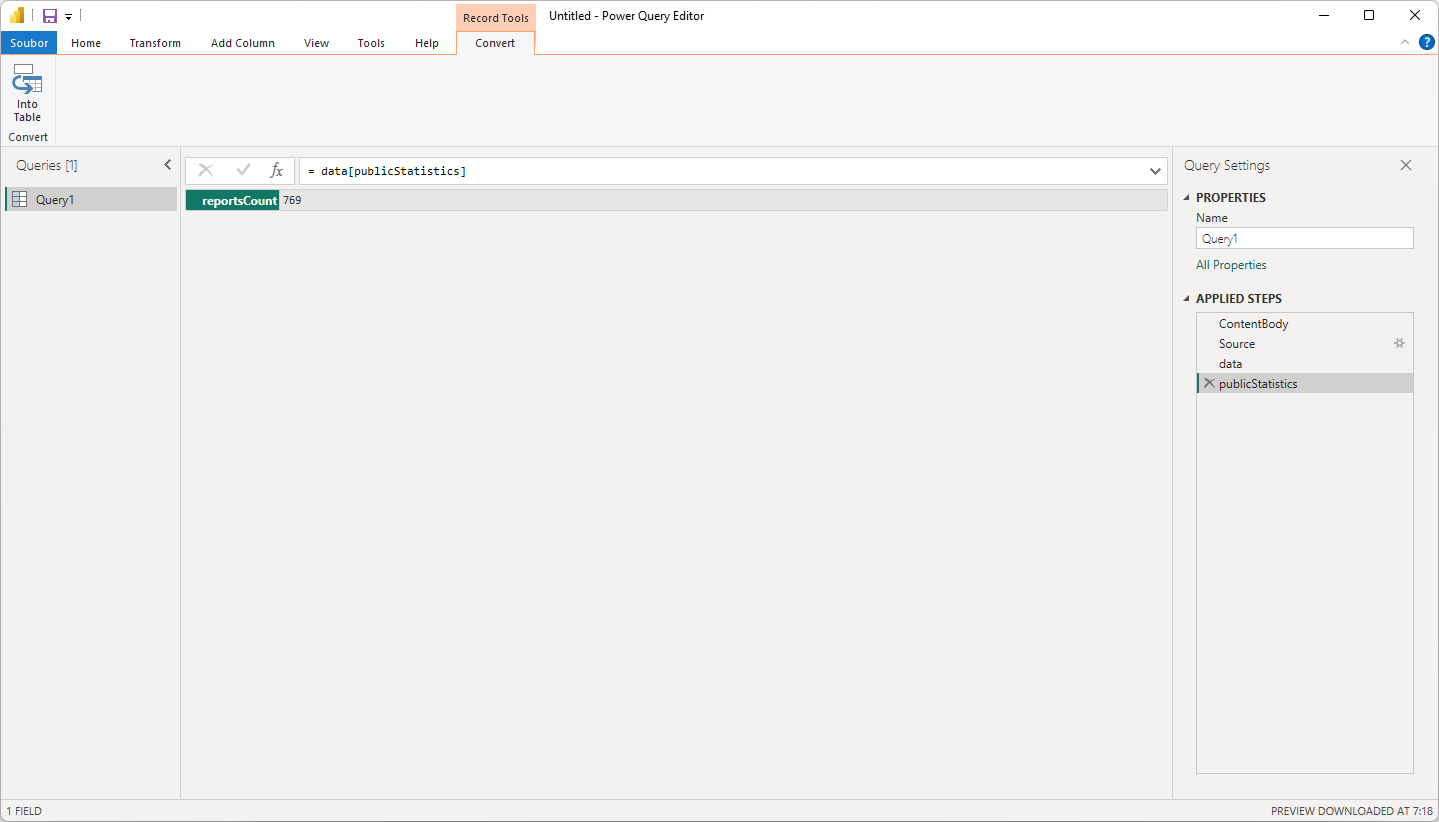
10. And if everything goes well the data will be loaded and you can then use them as you want.
Filters
You can filter by various fields. To filter the fields you need to change the query in the power query editor (see step 4 above). For example this query uses two filters (dateFrom and statuses):
query Statistics { publicStatistics( dateFrom: "2024-04-18", statuses: [Open] ) { averageViewTimePercentageChange }}
Available filters and possible values
It's necessary to wrap dates and tag in double quotes, other fields are written without them. Square brackets mean an array of values. Array can be empty or contain multiple values.
- dateFrom: "2024-04-17T01:34:56Z" - string in simplified ISO 8601 format YYYY-MM-DDTHH:mm:ssZ, "2024-04-07T01:34:56Z" indicates 1 hour in the morning 34 minutes 56 seconds on 7th April of 2024 with zero offset from UTC time zone, see https://tc39.es/ecma262/multipage/numbers-and-dates.html#sec-date-time-string-format for more details.
- dateTo: "2024-04-17" - see dateFrom
- statuses: [Archived, Closed, Open] - an array
- creationOrigins: [Member, Redaction, Reporter] - an array
- deadline: Later - single value, one of Later, Overdue, Soon, Today
- justifications: [Justified, Unjustified, Unknown] - an array
- priorities: [Low, Medium, High, Urgent] - an array
- sources: [Email, Hotline, InPerson, Other, Phone, ReportingSystem] - an array
- tag: "2afg4" - string
Structure of the response
The response can return following fields:
- openReportsCount - count of open reports
- archivedReportsCount - count of archived reports
- closedReportsCount - count of closed reports
- overdueReportsCount - count of overdue reports
- reportsCount - count of all reports
- Below _previous period_ means the same period as dateFrom to dateTo before dateFrom (e.g. if you specify two weeks to filter previous period is also two weeks). These fields are null if dateFrom is not specified.
- averageViewTimePercentageChange - returns change of average view time compared to previous period
- averageResolutionTimeChange - returns average resolution time change compared to previous period
- reportsCountChange - returns report count change compared to previous period
- averageResolutionTimeHours - average resolution time in hours
- averageViewTimeHours - average view time in hours
- reportCountByMonth - returns an array of objects with month and reportCount fields, each object representing one month with how many reports occurred that month
- reportsBullyingTypeByMonth - returns an object where each key is a month and the value is an object where each key is the name of category and values is the count of reports
- reportsByAssignee - returns and object where key is the name of member and the value is the count of reports they have assigned
- reportsByChannel - returns an object where key is the name of the channel and value is number of reports in that channel
- reportsByCompany - returns an object where key is the name of the organizational unit and value is number of reports in that channel
- reportsByLabel - returns an object where key is the name of the label and value is number of reports labeled with that label
- reportsByProblems - returns an object where key is the name of the category and value is number of reports in that category
- reportsBySource - returns an object where key is the source and value is number of reports in that source
- reportsByStatus - returns an object where key is the status and value is number of reports in that status
For example following query doesn't use filter and returns two values:
query Statistics { publicStatistics { openReportsCount reportsCount }}